The activity described below has been a hit in my Precalculus and Calculus classes. It helps students connect math to the real world. Midweek prior to the first day of class, I open the course on Brightspace and e-mail students an upbeat welcome message which not only contains the syllabus, but a link to a confidential Getting to Know You survey (for which they earn points toward their participation). I adapted the questions from the sample survey written by Michelle Pacansky-Brock. I specifically include the question, “What is one characteristic of a great class?” Many students will view or complete the survey before they even walk in the door. In the email I point them to my self-introduction on the Brightspace discussion forum where I share two truths and a lie, and ask them to follow suit (again, earning them points). Students earn a bonus point for sharing a photo. This ice-breaker builds community and belonging, shows them that I care about them, and sets the stage for the first day of class activity.
On the first day of class, as students walk toward the classroom, they are greeted by some upbeat, classy jazz music to set the tone, and the slide projected on the screen says “Let’s Have a Classy Class” with directions to write on their 3 x 5 index card at their place their name, major, hobbies and interests, and one quality of a great class. This helps me learn what they are hoping to expect from me, and I can affirm their wish if what they want from me matches what they will get. If curious, here is a Word Cloud of what students express. After they write their responses on the index card, they turn it over and relocate according to their group number written on the back. This lowers the chance for students to hyperbond with their friends in a way that can disrupt the class.
I then designate half a dozen students to serve as timekeepers. All timekeepers start a timer upon my go, and students share their full name and what they wrote is one quality of a great class. When it is a timekeeper’s turn to say what they wrote, they stop their timer. You can see a simulation of this HERE. The volunteer timekeepers have a built-in stopwatch on their phone, so all that is needed are the 3 x 5 index cards. I collect these cards at the end of the class period for attendance.
We then build a data set which gives the number N of persons who spoke and the elapsed time T, deciding together which is the independent variable and which is the dependent variable. Many students have been conditioned to make time the independent variable, so this activity provides a fun surprise. I ask students to discuss with their neighbor what they expect the plot to look like (concave up, concave down, no concavity), sketch it on their card, and give a reason. When students actually write their conjecture on their card, it heightens their commitment to their answer which increases their critical thinking. We also discuss if the graph should pass through the origin.
Students who conjecture that the plot is linear will share that each student typically takes the same amount of time to say their name and the answer to the prompt. At this point, I ask them to consider a scenario in which the first few persons took a very long time to answer compared to those near the end of the activity. In fact, this can happen if those at the end say “What is on my card has already been shared by someone else”, or they are just tired of the activity and want it to be over.
Typically, the data is remarkably linear, at least at certain intervals. I ask students to tell me the units and an interpretation of the slope (seconds per person that it took for each person to say their name and what is on their card.) Below is sample data collected at a professional development workshop with 38 teachers with seven time keepers. The first person who spoke was actually not a teacher, but an administrator who welcomed those present. Notice the linearity near the end of the activity.
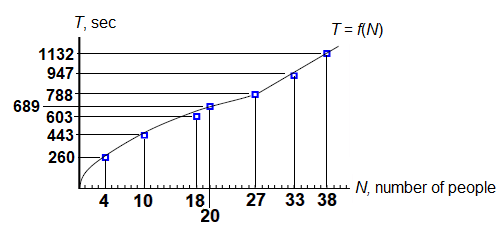
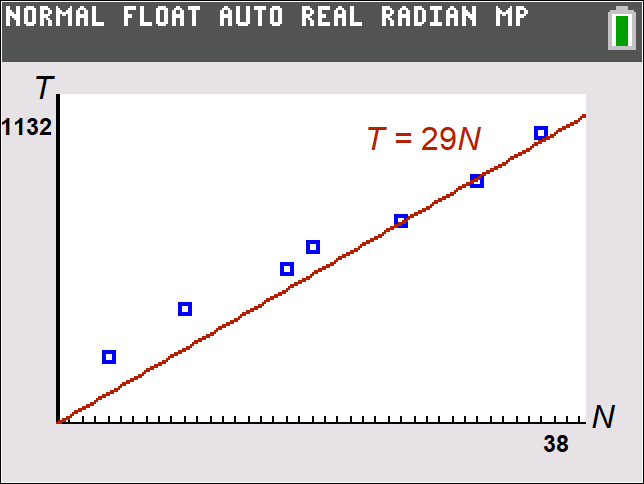
It can be tempting to use automatic routines to fit a formula to the data, but, instead, I ask those who just completed the self-introduction to give an estimate, call it m, of how long, on the average, did it take for each person to share their information during the interval over which it was linear. We then graph y = mx. For the teacher workshop, what they were asked to share took about 29 seconds, on the average, near the end of the activity.
Numerically, we then explored the value of the ratio T / N, found using list L3 to divide each value in list L2 by its mapped value in list L1. Because we want the graph to pass through the origin, this ratio represents the slope m of the segment through (0, 0) and the point (N, T), sketched below. The steeper the slope, the longer the time it took from the beginning of the activity. (The segments and labels were drawn using Word as done in the first image.)
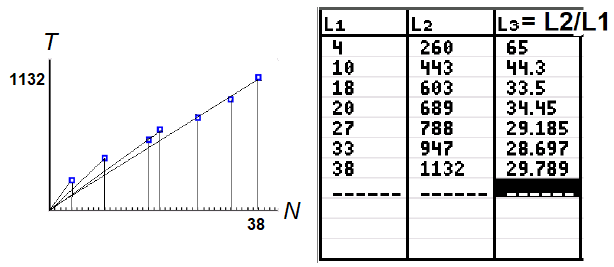
Alternatively, I could also have used the xyLine setting on the TI-84 Statplot to sketch segments in between the points.
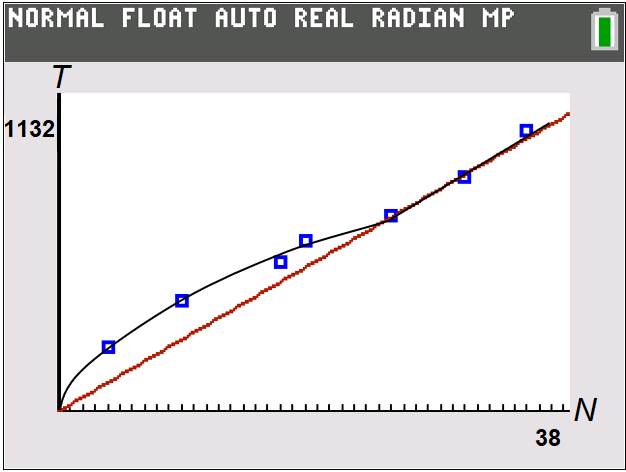
Below are both models shown with the plotted data.
The best part of this activity is that it builds community. You can’t possibly do this without everyone in the room participating, and each person can find where they are in the data set in between the timekeepers. They all have a personal connection with this data. Students are present when it is collected, and they can visualize how an outlier (long talker or short talker) affects the visual shape of the plot. Unlike some data collection activities which are unusable if an error is made, this activity is even better if an error is made.
The activity also introduces the big ideas in the course: rate of change, functions, concavity, and more.
I discuss this activity in this Webinar, where I also share one way to extend it for Calculus.
References
Pacansky-Brock, Michelle, Available at: How and Why to Humanize Your Course
LaMaster, J. and Casey, R., Success on Day One with the TI 84 Plus Family. Available at https://www.youtube.com/watch?v=6XNr64qvI0s&t=1976s
Watts, J. (2013). Why Hyperbonding Occurs in the Learning Community Classroom and What To Do About It. Learning Communities Research and Practice, 1(3), Article 4.
Available at: https://files.eric.ed.gov/fulltext/EJ1112854.pdf
